
Sample output
Inspect the work, with the assumptions attached.
Two kinds of evidence appear on this page, clearly separated: genuine pilot-generated report pages from one synthetic workers'-compensation case (run 7347e4dd), and an illustrative walkthrough of the validation mechanics. Everything is synthetic; every report is draft.
Synthetic data Draft — pending review
The synthetic pilot case
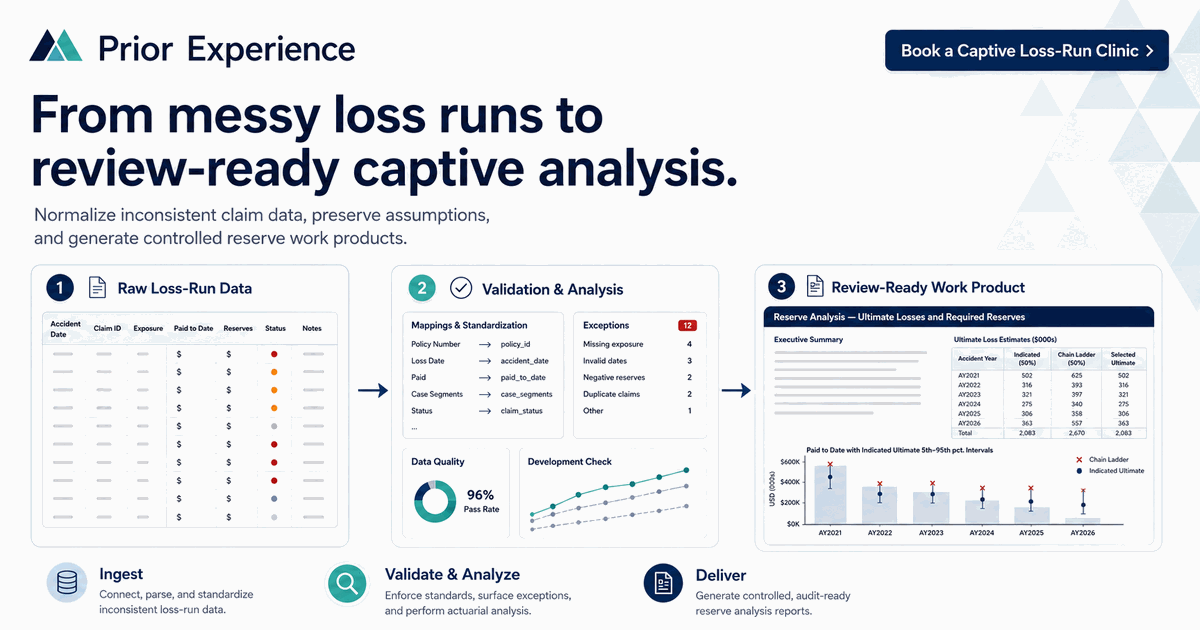
One synthetic captive writing workers' compensation. Six annual TPA loss-run snapshots, evaluated 2021-12-31 through 2026-12-31, are reconciled claim-by-claim — 21 claims growing to 119 — with each snapshot tied to its printed totals before any analysis runs. The pilot application then produces a reserve analysis with a permanent chain-ladder reference, a modeled uncertainty range, a funding-by-confidence-level exhibit, and an audit trail that stamps every assumption, data snapshot, and model diagnostic onto the run identifier.
The workflow at a glance
Reserve analysis by accident year Synthetic pilot output
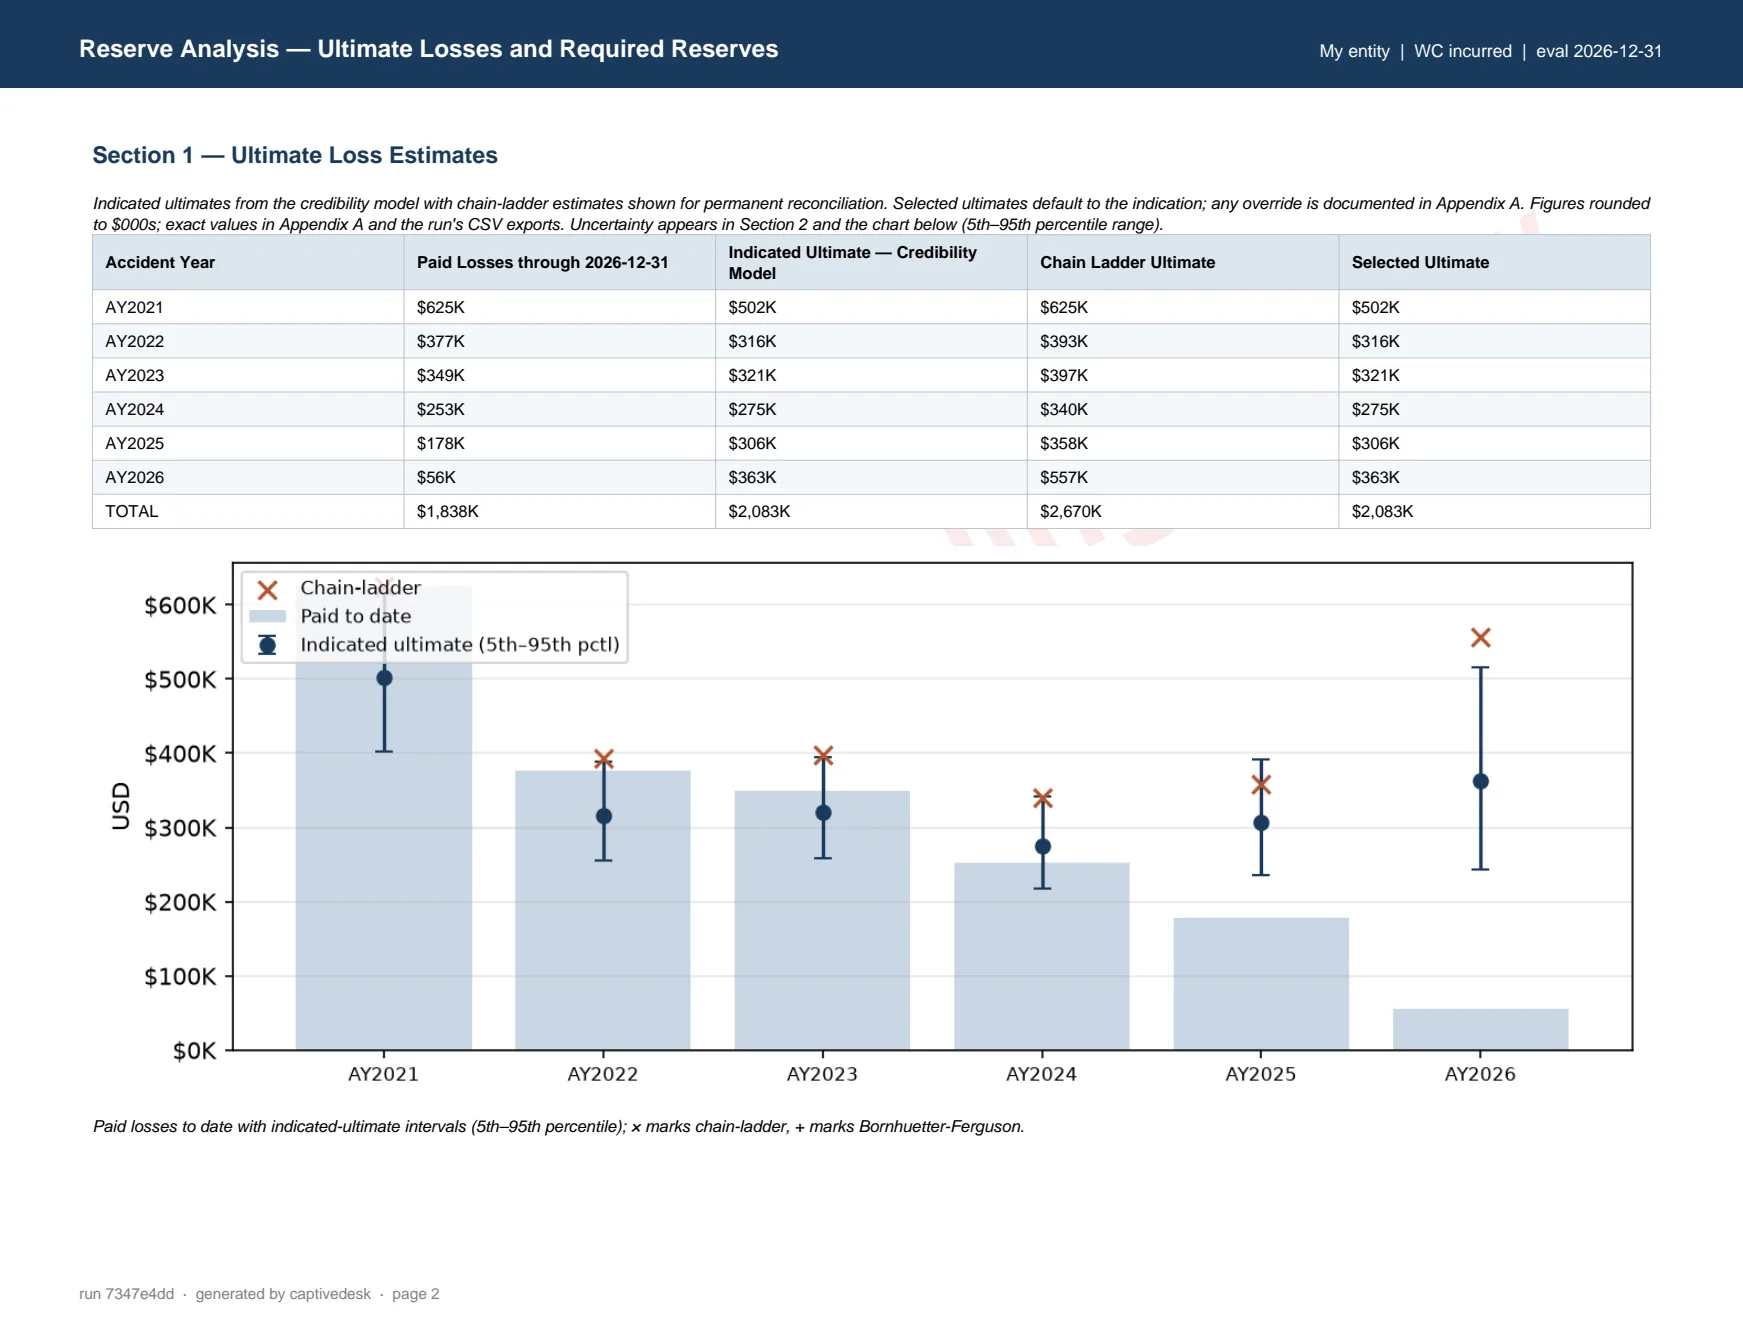
Compares modeled ultimate losses with a permanent chain-ladder reference and shows the uncertainty range behind the selected estimate. The chain-ladder column reconciles to the age-to-age factors and cumulative development factors in the report's own appendix; selected ultimates default to the model indication, and any override would be documented in the audit trail with reason and approver. Where the indication sits below paid-to-date for mature years, the report presents it as a finding to review — visible on the chart — rather than smoothing it away.
Validation and lineage Synthetic pilot output
Before any estimate is produced, each loss-run snapshot is reconciled and tied to its printed totals, and every assumption is stamped onto the run. These excerpts come directly from the report's audit trail:
Data lineage — snapshots used
| Snapshot | Evaluation | Claims | Tie-out |
|---|---|---|---|
| 792ed0a0 | 2021-12-31 | 21 | tied |
| 6b3d46a1 | 2022-12-31 | 42 | tied |
| 875374b5 | 2023-12-31 | 62 | tied |
| a623c10d | 2024-12-31 | 82 | tied |
| d29bb3d5 | 2025-12-31 | 103 | tied |
| 67737bd0 | 2026-12-31 | 119 | tied |
Stamped assumptions (excerpt)
| Key | Statement |
|---|---|
| tail_factor | 1.000 — none assumed beyond selected maturity |
| recoveries | Paid/incurred totals are net of recoveries |
| latest_diagonal | Observed data only; never extrapolated |
| credibility | Entity experience weight Z = 0.86 |
The full audit trail also records the benchmark prior, model diagnostics, and every failed and successful fit attempt.
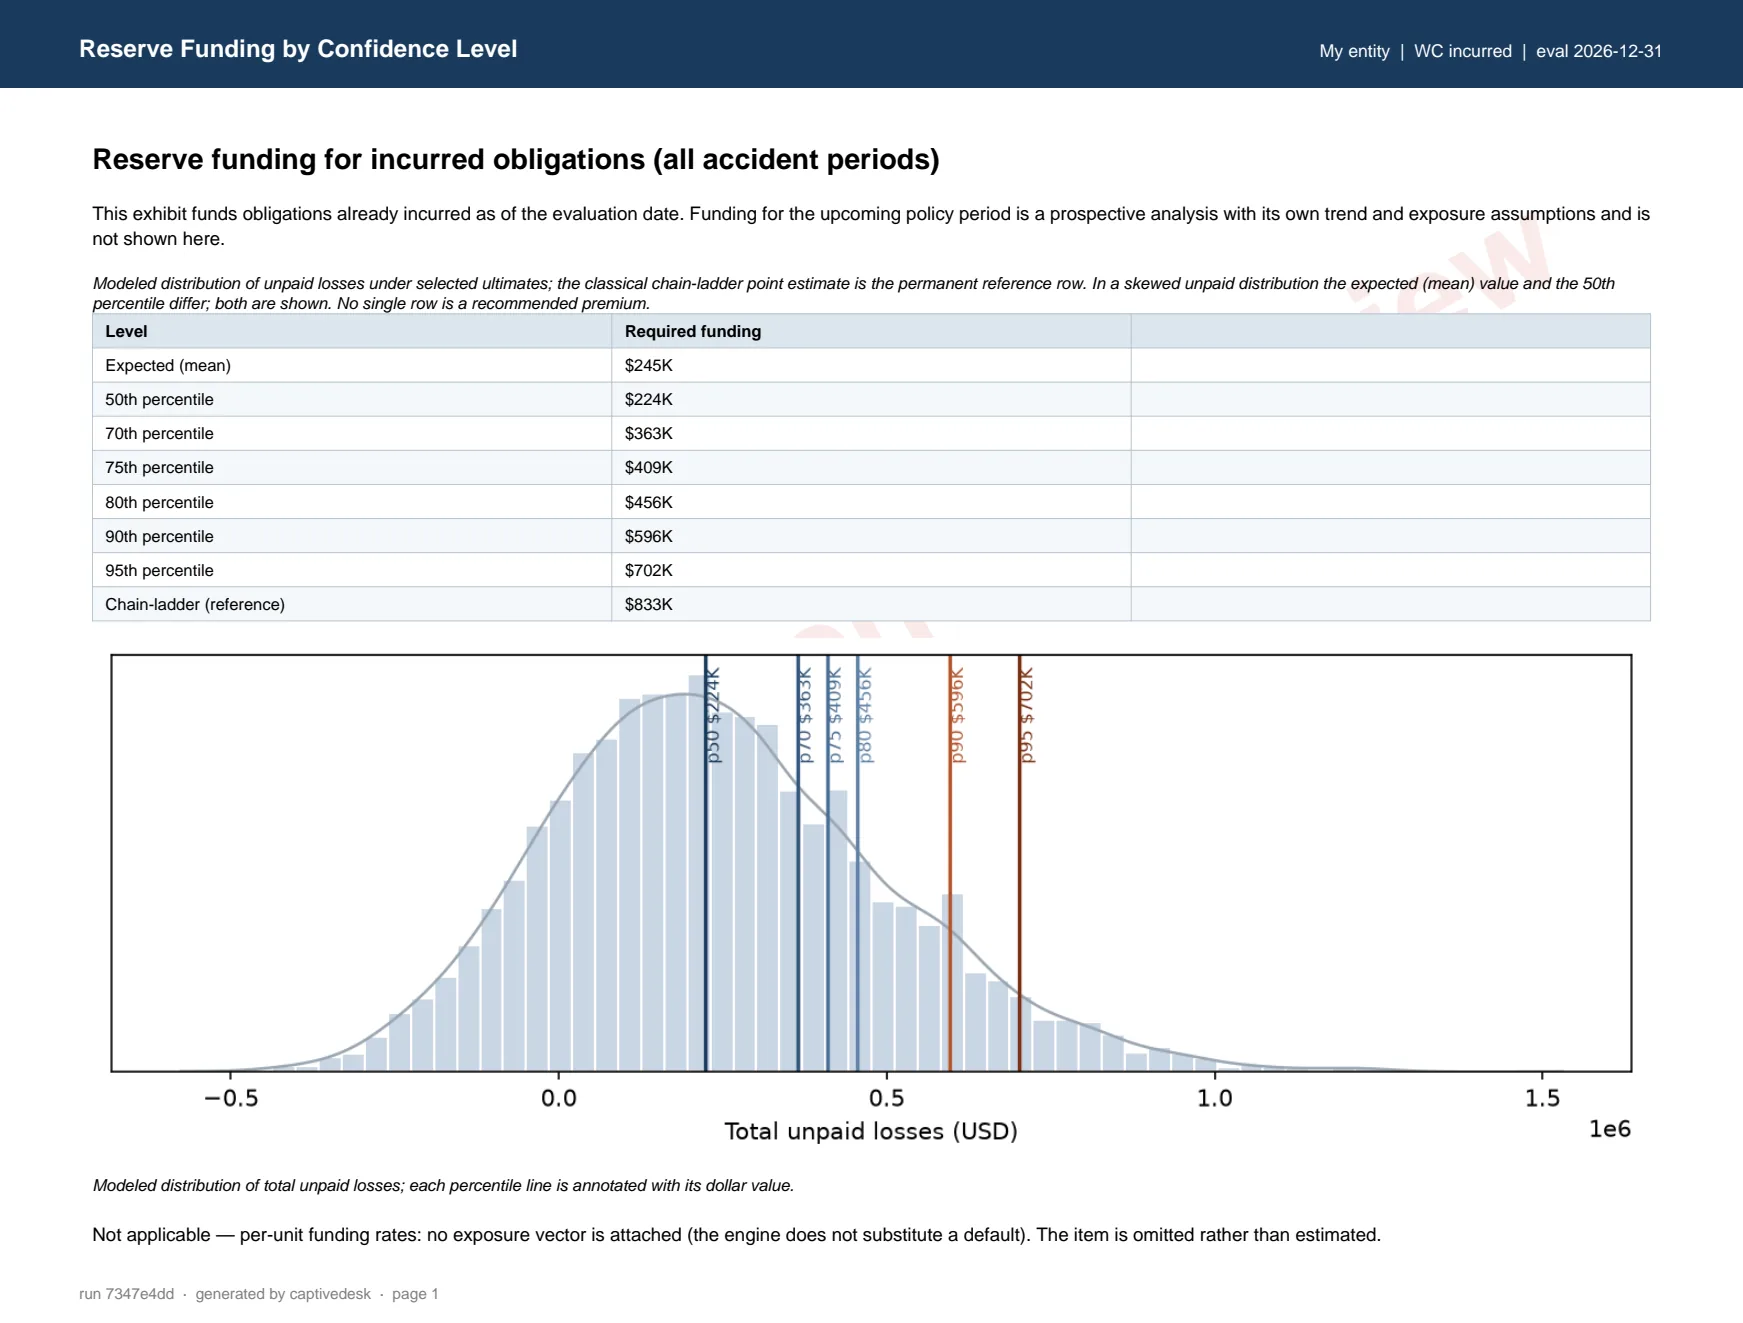
Reserve funding by confidence level Synthetic pilot output
How validation works — illustrative walkthrough
The pilot reports above show finished work products. The examples below are a separate, simplified illustration — built by hand with synthetic general-liability rows — showing the kinds of mapping and exception decisions the validation stage records. They are not application screenshots.
| CLM # | DOL | PD_AMT | CASE RSV | INCUR | STATUS |
|---|---|---|---|---|---|
| GL-4417 | 03/14/23 | $12,450.00 | 2,000 | 14,450 | O |
| 4417 | 2023-03-14 | 12,450 | 2,000 | 14,450 | Open |
| GL-4522 | 14-Mar-23 | (1,200.00) | N/A | -1200 | RO |
| GL-4610 | 05/02/2024 | 8,900 | 8,900 | CLSD? | |
| GL-4610A | 05/02/2024 | 1,150 | 0 | 1,150 | C |
| claim_id | date_of_loss | paid_loss | case_reserve | reported_incurred | status | src |
|---|---|---|---|---|---|---|
| GL-4417 | 2023-03-14 | 12,450 | 2,000 | 14,450 | open | Q4:r17 |
| GL-4522 | 2023-03-14 | -1,200 | 0 | -1,200 | reopened | Q4:r31 |
| GL-4610 | 2024-05-02 | 10,050 | 0 | 10,050 | closed | Q4:r44+r45 |
✓ duplicate row removed · identifier change merged after confirmation · original source values retained per row
| ID | Type | Detail | Resolution |
|---|---|---|---|
| EX-014 | Duplicate row | GL-4417 appears twice with different header casing | Removed duplicate; source rows retained |
| EX-015 | Missing value | Case reserve blank on closed claim GL-4610 | Set to 0 for closed status; noted |
| EX-016 | Identifier change | GL-4610A appears after Q3; same DOL and claimant key | Merged after confirmation; both ids retained |
| EX-017 | Reconciliation | Reported incurred column ≠ paid + case on 4 rows | Open — pending TPA confirmation |
| Measure | Source files | Adjustments | Normalized | Difference |
|---|---|---|---|---|
| Claim rows | 142 | −3 duplicates | 139 | 0 |
| Paid loss | 4,096,850 | −26,250 duplicates | 4,070,600 | 0 |
| Case reserves | 579,000 | −2,000 duplicates | 577,000 | 0 |
| Reported incurred | 4,675,850 | −28,250 duplicates | 4,647,600 | 0 |
Reported incurred = paid loss + case reserves throughout (4,070,600 + 577,000 = 4,647,600). Adjustments are itemized in the exception log.
Methodology notes and limitations
The pilot reports estimate ultimate losses with a credibility model that blends the entity's own development experience with a stated external benchmark, and print a deterministic chain-ladder estimate beside every indicated figure so that divergence between approaches is a visible finding rather than a hidden one. Assumptions — tail factor, benchmark prior and its weight, credibility, and data conventions — are stamped on the run, and model diagnostics are reported including failed fit attempts. A real engagement would involve the reviewing actuary's own method choices and selections.
These samples are not actuarial opinions. They are draft, opinion-support work products built entirely from synthetic data, shown to demonstrate how the work is documented.
Full report downloads
Complete PDF reports will be posted here after each one passes internal QA review. The pages shown above are from reports whose displayed figures have been verified; remaining reports in the same run are still under review and are deliberately not published yet.
Want this run on a loss run shaped like yours?
Synthetic or redacted data is welcome.